안녕하세요.
아래와 같은 리스트뷰 아이템을 만들고 있습니다.
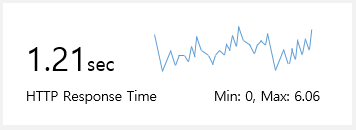
TextView 몇 개가 들어가는데 이건 문제가 아니구요.
우측에 차트가 있습니다. achartengine 사용중입니다.
레이아웃 구성은 LinearLayout 2층으로 구성한 다음 위쪽에 다시 좌우로 구분하여
위쪽 우측 LinearLayout에 addView하여 차트를 올려놓았습니다. (소스에 있음)
실시간으로 데이터를 받아와 차트에 시각화된 데이터를 보여주는데요.
구현 소스는 아래와 같습니다.
ViewHolder 클래스를 만들어서 getView 메소드에서 처리하는 방법은 이해가 가는데,
차트 같은 경우에는 어떻게 처리해야 할지 잘 모르겠습니다.
그리고 ViewHolder 클래스에 chartbkground 라는 LinearLayout 변수를 하나 선언했는데
이것이 굳이 쓰이지 않아도 될 것 같은데 확인만 부탁드리겠습니다.
감사합니다.
package com.exem.epikxm.chartlistviewexample;

import android.content.Context;
import android.graphics.Color;
import android.graphics.Typeface;
import android.view.LayoutInflater;
import android.view.View;
import android.view.ViewGroup;
import android.widget.BaseAdapter;
import android.widget.LinearLayout;
import android.widget.TextView;

import org.achartengine.GraphicalView;

import java.util.List;

public class ChartAdapter extends BaseAdapter {

    private List<ChartLayoutData> data = null;
    private LayoutInflater layoutInflater;
    private Context context = null;
    private GraphicalView view = null;

    public ChartAdapter(Context context) {
        this.context = context;
        layoutInflater = LayoutInflater.from(context);
    }

    public void loadData(List<ChartLayoutData> lst) {
        this.data = lst;
        this.notifyDataSetChanged();
    }

    @Override
    public int getCount() {
        return data == null ? 0 : data.size();
    }

    @Override
    public Object getItem(int position) {
        return data.get(position);
    }

    @Override
    public long getItemId(int position) {
        return position;
    }

    @Override
    public View getView(int position, View convertView, ViewGroup parent) {
        ViewHolder holder;

        String statname = "";
        TextView statName = null;
        LineChart lineChart = null;
        LinearLayout backgroundLinearLayout = null;

        if (convertView == null) {
            holder = new ViewHolder();
        }

        // 차트 생성부분
        // 여기에서 리스트뷰 스크롤시 아래쪽 차트가 위쪽 차트랑 겹치기도 하고
        // 제대로 나오기도 하고 이상하게 동작합니다.
        // 차트를 여기서 생성하여 붙이면 안되는것인지?
        // ViewHolder 클래스를 어떻게 이용해야 좋을지 잘 모르겠네요.
        lineChart = new LineChart();
        if (lineChart.getCompleteSeries() == true) {
            lineChart.CreateScatterChart(this.context, data.get(position).getStatName());
            view = lineChart.getView(this.context);
            view.setBackgroundColor(Color.WHITE);
            backgroundLinearLayout.addView(view, new LinearLayout.LayoutParams(
                    LinearLayout.LayoutParams.MATCH_PARENT,
                    LinearLayout.LayoutParams.MATCH_PARENT
            ));
            Const.views.add(view);
            Const.lineCharts.add(lineChart);
        }

        if (convertView == null) {
            convertView = layoutInflater.inflate(R.layout.view_item, null);
            holder = new ViewHolder();

            Typeface mTypeface = Typeface.createFromAsset(this.context.getAssets(), "fonts/Roboto-Light.ttf");

            holder.statName = (TextView) convertView.findViewById(R.id.statName);
            holder.chartbkground = (LinearLayout) convertView.findViewById(R.id.chartBackground);
            holder.statName.setTypeface(mTypeface);

            convertView.setTag(holder);
        } else {
            holder = (ViewHolder) convertView.getTag();
        }

        ChartLayoutData chartLayoutData = data.get(position);
        holder.statName.setText(null);
        statname = chartLayoutData.getStatName();
        holder.statName.setText(statname);

        return convertView;
    }

    static class ViewHolder {
        TextView statName;
        LineChart mlineChart;
        LinearLayout chartbkground;
    }
}