MpAndroidChart 에서 bar chart를 사용 중 인데요
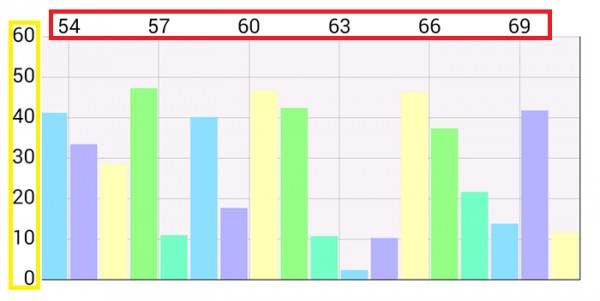
bar chart에서 노랑색 부분을 데이터값으로 붉은색 부분을 데이터값을 측정한 날짜로 해서
그래프를 만들고 싶습니다.
붉은색 부분은 차트 아래로 내리고 싶습니다
코드는 다음과 같이 작성을 하였습니다.
추가적인 질문인데요 파이어베이스 데이터값을 저장을 하는데 이것을 불러와서 그래프로
구현하는 방법을 알려주시면 감사하겠습니다.
public class Activity_Graphy  extends Fragment implements OnChartValueSelectedListener {

    FirebaseDatabase database = FirebaseDatabase.getInstance();    // 데이터 베이스
    DatabaseReference ref = database.getReference();               // 데이터 베이스의 정보


    protected Typeface mTfRegular;
    protected Typeface mTfLight;
    protected BarChart mChart;
    View v;

    @Nullable
    @Override
    public View onCreateView(LayoutInflater inflater, @Nullable ViewGroup container, Bundle savedInstanceState) {
        //inflate메소드는 XML데이터를 가져와서 실제 View객체로 만드는 작업을 합니다.
        v = inflater.inflate(R.layout.activity_graphy, container, false);

        ref.addListenerForSingleValueEvent(new ValueEventListener() {
            @Override
            public void onDataChange(DataSnapshot dataSnapshot) {
                for (DataSnapshot snapshot : dataSnapshot.getChildren()) {
                    String key = snapshot.getKey();
                    Log.i(TAG, key);
                }
            }

            @Override
            public void onCancelled(DatabaseError databaseError) {
                Log.w("Activity_Graphy", "loadPost:onCancelled", databaseError.toException());
                Log.w("Activity_Graphy", "loadPost:onCancelled", databaseError.toException());
                Log.w("Activity_Graphy", "loadPost:onCancelled", databaseError.toException());
            }
        });

        mChart = (BarChart) v.findViewById(R.id.barChart);
        ArrayList<BarEntry> barEntries = new ArrayList<>();
        barEntries.add(new BarEntry(120f, 99f));
        barEntries.add(new BarEntry(180f, 45f));
        barEntries.add(new BarEntry(250f, 10f));
        barEntries.add(new BarEntry(0f, 10f));

        ArrayList<String> labels = new ArrayList<String>();
        labels.add("January");
        labels.add("February");
        labels.add("March");
        labels.add("April");
        labels.add("May");
        labels.add("June");
        labels.add("July");
        labels.add("August");
        labels.add("September");
        labels.add("October");
        labels.add("November");
        labels.add("December");

        BarDataSet dataSet = new BarDataSet(barEntries,"# of Calls");

        BarData data = new BarData(dataSet);
        dataSet.setColors(ColorTemplate.COLORFUL_COLORS); //
        data.setBarWidth(9f);                                // 사용자 정의 막대 너비
        mChart.setData(data);
        mChart.setFitBars(true);                            // x 축을 모든 막대
        mChart.invalidate();                                 // 새로 고침
        /*dataset.setDrawCubic(true); //선 둥글게 만들기
        dataset.setDrawFilled(true); //그래프 밑부분 색칠*/

        mChart.setData(data);
        mChart.animateY(5000);

        return v;
    }